Concepts
Zones
How Runtool builds training zones: the thresholds every boundary is anchored to, where those anchors come from, what the starting estimates are worth, and how zone definitions are versioned.
Zones express training intensity as a range you can run to. Runtool prescribes running with pace zones and tracks effort with heart rate zones; every workout target and every time-in-zone chart reads from them. Zones live under Settings → Zones for each athlete. See Athlete settings.
Every boundary is a threshold
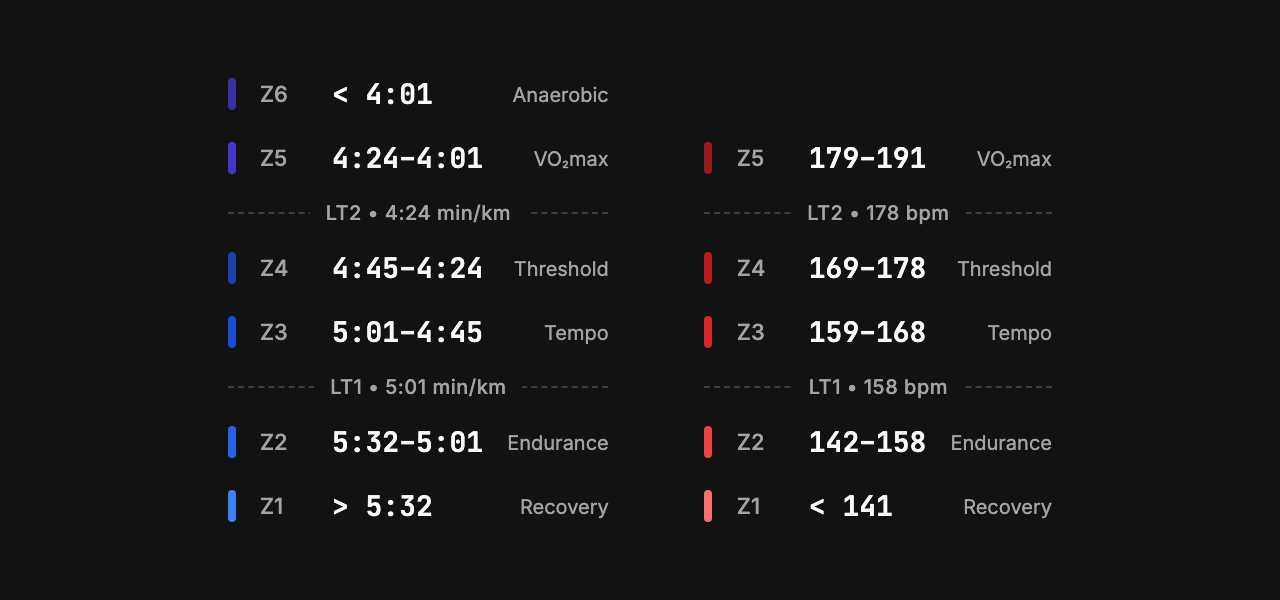
Runtool's zones are not fractions of a maximum. They are built around three points in your physiology:
| Anchor | What it is |
|---|---|
| LT1 | Aerobic threshold, the fastest you can run while lactate stays near resting levels |
| LT2 | Lactate turnpoint, the hardest effort you can hold steadily, roughly an hour at best |
| vVO₂max | The speed at which you reach maximum oxygen uptake, around 3K race pace |
Every zone boundary is one of those three, or a fixed step from one:
| Boundary | Sits at | Meaning |
|---|---|---|
| Z1 / Z2 | 10% slower than LT1 | everyday easy ends, steady running begins |
| Z2 / Z3 | LT1 | the top of genuinely easy running |
| Z3 / Z4 | midway between LT1 and LT2 | tempo ends, threshold work begins |
| Z4 / Z5 | LT2 | the turnpoint, the limit of steady effort |
| Z5 / Z6 | vVO₂max (≈13% faster than LT2) | intervals end, repetitions begin |
The six zones that fall out of it:
| Zone | Name | What it is | RPE |
|---|---|---|---|
| Z1 | Easy | Everyday aerobic running | 1–2 |
| Z2 | Steady | The top of easy running, up to LT1 | 3–4 |
| Z3 | Tempo | Between LT1 and marathon effort, comfortably hard | 5–6 |
| Z4 | Threshold | The LT2 band, sustained hard running | 7 |
| Z5 | VO₂max | Interval pace, maximal aerobic power | 8–9 |
| Z6 | Anaerobic | Faster than VO₂max, repetition and sprint work | 10 |
Most training volume falls in Z1 and Z2. The purpose of the boundaries is to keep easy days below LT1 and to place hard days at the intensity they were designed for.
The RPE column, the effort words each zone answers to, and how to rename a zone are on the Intensity page.
Why thresholds and not percentages of your maximum
Most training plans split intensity by percentage: 60/70/80/90% of maximum heart rate, or the same split applied to heart-rate reserve, which is the Karvonen method Karvonen et al., 1957. Those splits are simple to calculate, but they are not tied to a physiological transition.
Two problems follow, and together they are why your zones here will not match your watch's.
Your turnpoint is not at a fixed percentage of your maximum. Where LT2 sits relative to maximum heart rate varies widely between people, and it rises with training. A fixed 80% band therefore describes a different intensity for two runners, and a different intensity for the same runner six months later. This is the standing objection to percentage-of-maximum zones in the research: the bands do not line up with the transitions they claim to mark (Jamnick et al., 2020; Faude et al., 2009).
Maximum heart rate is usually estimated too. Age-based formulas predict a population average, and individuals scatter widely around it Tanaka et al., 2001. A zone set as a percentage of an estimated maximum inherits that error.
Thresholds avoid both. LT1 and LT2 are the points at which the physiological response changes, and they move with training, so the zones move with them. This also matters for intensity distribution: well-trained endurance athletes spend a large share of training below LT1, a small share well above LT2, and little in between (Seiler & Kjerland, 2006; Seiler, 2010). Distributing training that way requires knowing where your own LT1 and LT2 are.
Where your anchors come from
Open Settings → Zones and pick the method that matches what you know. Each one either measures your anchors or estimates them, and that distinction matters more than the choice between the estimates:
| Method | Anchors are | Use it when |
|---|---|---|
| Lactate test | Measured | You have step-test data, from a lab or the track |
| Race result | Estimated | You have a recent race. The most accurate of the estimates |
| Predicted race | Estimated | You have no recent race and can judge your shape |
| Custom | Yours | You know your boundaries and want to set them |
A lactate test is the only method here that measures where your thresholds are. The others predict them from a model fitted to other runners, and each is an approximation of what a test would return.
From a race. The finish time gives a VDOT, a fitness number derived from the pace-and-distance relationship in Jack Daniels' work Daniels, 2013. Runtool uses VDOT only to place your anchors: LT2 near half-marathon effort, LT1 between easy and marathon pace, vVO₂max around 3K effort. The spacing shifts with VDOT, because thresholds sit closer together in fitter runners, so two runners with different race times get differently shaped zones rather than the same shape scaled.
From a lactate test. Enter the test as steps (pace, heart rate and blood lactate for each one), then pick how the thresholds should be read from the curve:
| Method | How it reads the curve |
|---|---|
| Modified D-max | The largest departure from the straight line through your own curve. The default. |
| Fixed 2 / 4 mmol | The classic fixed lactate concentrations |
| Dickhuth | A fixed rise above your own lactate minimum |
The methods disagree by design, and the disagreement is well documented Faude et al., 2009. A fixed 4 mmol point assumes every athlete's turnpoint sits at the same concentration, which is the assumption the individualised methods exist to avoid. You can switch method and see the zones change before saving. If you already know your LT1 and LT2, skip the protocol and enter them directly.
From heart rate alone. If you only know your maximum heart rate, Runtool estimates your threshold heart rate at 92% of it and builds the heart-rate zones from there. It is the least precise input in the system. See below.
What the default zones assume
Runtool always provides a working set of zones, because a workout target cannot be resolved without one. Every number in that starting set comes from published work, and every one is a population fit rather than a measurement of your physiology.
The assumptions, in full:
| Default | What it assumes |
|---|---|
| LT1 sits between easy and marathon pace | Your aerobic threshold falls where it does for most runners at your VDOT |
| LT2 sits between marathon and 15K pace | Your turnpoint is near half-marathon effort |
| vVO₂max is about 87% of LT2 pace | The gap from threshold to maximal aerobic power is the usual one |
| The Z1/Z2 line is 10% slower than LT1 | Recovery sits a fixed step below easy for you |
| The Z3/Z4 line is halfway from LT1 to LT2 | Tempo and threshold split evenly between your two thresholds |
| Threshold heart rate is 92% of maximum | Your LTHR falls at the trained-runner average, and your maximum is right |
| The heart rate bands are 82/89/94/100% of LTHR | Friel's fractions describe you Friel, 2009 |
Each assumption holds for most runners and can be wrong for an individual. The further your physiology sits from the population middle, the more likely that is: very high or very low mileage, a sprint background, a long endurance history, a large gap between track and road form. The model cannot detect any of this, because it has no measurement of you.
Two measurements replace parts of the starting set:
- A lactate step test, in a lab or on a track, measures LT1 and LT2 directly. It replaces the two assumptions the pace model rests on, and it is the input the rest of the system is built to receive.
- A 30-minute time trial replaces your estimated threshold heart rate with a measured one. Run 30 minutes as hard as you can hold; your average heart rate over the final 20 minutes is your threshold heart rate. It takes one session and no equipment beyond a heart-rate monitor.
Your zones page names the method that produced the set in force, so it is always visible whether a zone came from a measurement or an estimate.
Heart rate zones
Heart rate uses Joe Friel's five-zone model Friel, 2009, set as percentages of your lactate threshold heart rate (LTHR) rather than of your maximum:
| Zone | Name | % of LTHR |
|---|---|---|
| Z1 | Recovery | under 82 |
| Z2 | Endurance | 82–89 |
| Z3 | Tempo | 89–94 |
| Z4 | Threshold | 94–100 |
| Z5 | VO₂max | above 100 |
These percentages are one way of placing the bands once LTHR is known. The anchor is still a threshold: Z5 opens at LTHR by definition.
Heart rate has five zones where pace has six, so the two ladders do not line up name for name. Heart rate Z1 is recovery; pace Z1 is everyday easy running. Prescriptions are written in pace zones, and the effort words and RPE on the Intensity page all refer to those.
A lactate test changes this. It measures LT1 directly, so your measured LT1 heart rate becomes the Z2/Z3 boundary in place of the 89% estimate. Measurements replace estimates, and not the reverse.
Pace is the primary prescription for running: it responds immediately and does not drift within a session. Heart rate records the effort that produced it, so the same pace at a lower heart rate indicates improved fitness. The relationship between the two is the basis of the efficiency metrics in Analyse.
Zone definitions are versioned
Zones are versioned, never overwritten. When you update them, the previous set is kept with its validity period, and every past workout is read against the zones that were active when it happened. A fitness change does not rewrite your training log. The Definitions list shows every set you have had, with the method and inputs behind each.
A definition does not have to cover both pace and heart rate. Updating only your heart rate zones, after a maximum heart rate test for example, saves a heart-rate-only definition, and your pace zones continue from the definition that set them. Active zones shows what is in force now, which may come from two different definitions.
Where zones show up
- Workout targets:
8x1km @ Z4resolves to real paces when the workout is created. - Completions: time in zones, rep by rep, planned against executed.
- Training load: your LT2 splits a session's aerobic work from its anaerobic work, and your pace zones price a run you logged by hand.
- Analyse: efficiency metrics compare your paces and heart rate against your zones over time.
FAQ
Why don't my zones match my watch's?
Most watches split heart rate by percentage of maximum. Runtool anchors on your lactate thresholds. The two agree only by coincidence, and the gap is usually largest in the middle zones. To bring them closer, set your watch's zones from the boundaries on your Runtool zones page rather than the other way round.How often should I update my zones?
When fitness changes measurably, typically after a race, a fitness test, or a long training block. Zones that are months stale prescribe the wrong paces in both directions.Do I need a lactate test?
No. A recent race result is a solid anchor, and many runners use nothing else. A test is the only method here that measures your thresholds rather than predicting them, so it is the largest available improvement in accuracy. It is most useful when your race results and your training feel disagree, when you are returning after a long break, or when your training volume is high enough that a few percent of misplaced threshold pace accumulates over a block.My max heart rate is a guess. Does that matter?
Not for pace zones, which do not use it. For heart rate zones, yes: they are shifted by however far the estimate is off. A 30-minute time trial replaces it and takes one session.Why six pace zones but five heart rate zones?
Above VO₂max effort, heart rate no longer separates zones: a 400m repetition and a sprint both reach maximum. Pace still separates them, so pace gets the sixth zone. Five is also where Friel's model sits, for the same reason.Can I update just my heart rate zones?
Yes. Save a heart-rate-only definition and your pace zones stay as they were, resolving from the definition that set them. The same applies in reverse: anchoring pace zones to a new race result leaves your heart rate zones alone.Can my coach change my zones?
Yes. Zones belong to the workspace, and both coach and athlete work with the same set. Every change is recorded in the definitions list.References
- Daniels, J. (2013). Daniels' Running Formula, 3rd ed. Human Kinetics. ISBN 9781450431835
- Faude, O., Kindermann, W. & Meyer, T. (2009). Lactate threshold concepts: how valid are they? Sports Medicine 39(6), 469–490. 10.2165/00007256-200939060-00003
- Friel, J. (2009). The Triathlete's Training Bible, 3rd ed. VeloPress. ISBN 9781934030196
- Jamnick, N.A., Pettitt, R.W., Granata, C., Pyne, D.B. & Bishop, D.J. (2020). An examination and critique of current methods to determine exercise intensity. Sports Medicine 50(10), 1729–1756. 10.1007/s40279-020-01322-8
- Karvonen, M.J., Kentala, E. & Mustala, O. (1957). The effects of training on heart rate: a longitudinal study. Annales Medicinae Experimentalis et Biologiae Fenniae 35(3), 307–315. PMID 13470504
- Seiler, K.S. & Kjerland, G.Ø. (2006). Quantifying training intensity distribution in elite endurance athletes: is there evidence for an "optimal" distribution? Scandinavian Journal of Medicine & Science in Sports 16(1), 49–56. 10.1111/j.1600-0838.2004.00418.x
- Seiler, S. (2010). What is best practice for training intensity and duration distribution in endurance athletes? International Journal of Sports Physiology and Performance 5(3), 276–291. 10.1123/ijspp.5.3.276
- Tanaka, H., Monahan, K.D. & Seals, D.R. (2001). Age-predicted maximal heart rate revisited. Journal of the American College of Cardiology 37(1), 153–156. 10.1016/S0735-1097(00)01054-8