Views
Analyse
The Analyse view. Chart a recurring workout over time and drill into the sessions behind it.
Analyse charts your completed training over time. Pick the workout you want to follow, pick what to measure, and the chart and the list underneath stay in sync, so every point on the chart is a workout you can open.
Recurring workouts
The picker on the left lists the workouts you actually repeat, most frequent first. It is built from your own history, so it is always current and needs no setting up. Selecting one charts every time you have run it.
A workout is identified by the work it repeats, not by how much of it you did. Fifteen, sixteen and twenty times 400m are the same workout at three volumes, so they chart together and the trend across them is readable. The row shows the spread underneath the name, so you can see what varies: how many reps, what recovery, at what intensity.
Warmups and cooldowns never affect which workout something is. Neither does the recovery you took, so a session with a 60 second jog and the same session with 90 seconds standing are one workout.
A rep your watch split in two is still one rep. A 1200m rep recorded as 800m plus a faster last 400m counts as 1200m, so it charts alongside the same session run without the split.
Sets are part of what a workout is. Ten times 400m and two sets of five are the same total work and not the same session. Sets that change size are kept as you ran them: a 5-4-3 is a 5-4-3, not three fours.
Easy runs and long runs are identified by category alone. An easy 5km and an easy 8km are both easy runs, and there is nothing useful in separating them.
| Row | What it covers |
|---|---|
| Easy runs | Every easy run, whatever the distance |
| Long runs | Every long run |
| 400m reps | Every session built on 400m reps, at any rep count |
| 2x400m reps | The same work in two sets, which is a different session |
| (5-4-3)x300m | Sets that change size, kept as they were run |
| 45s reps | Sessions built on timed reps |
Where a coaching framework describes the same shape, its name appears underneath, or several names when several claim it, because 400m reps belong to more than one. It is context, not a relabelling: running ten times 1km does not put you on anyone's plan.
Reps run to a marker and reps run to a clock stay separate, because they are different choices. A session on one basis shows the nearest session on the other beside it, worked out from the pace you actually held: 1200m reps sit next to 4-minute reps if that is what 1200m takes you, and next to 6-minute reps if it takes you that.
Searching
Free text sits at the bottom of the picker, for when you want something the list does not cover. It matches workout names and structures.
You can also reach a chart straight from search. Typing analyse offers your most frequent workouts. Typing a workout, like 8x1km or 400m, offers to chart it alongside the workouts that match it.
Measures
The picker lists every measure with a line on what it tells you. This page uses the same three groups.
Volume
Totalled per week, because a single run says little about whether training is building.
| Measure | What it tells you |
|---|---|
| Distance | The headline volume number: whether training is building, holding, or quietly falling off. |
| Duration | Volume in time rather than distance. The fairer comparison when terrain or conditions swing week to week. |
| Elevation | Total climbing. Worth watching before a hilly race, or when pace drops for reasons pace alone can't explain. |
| Training Load | Total training stress across every sport, not just running. |
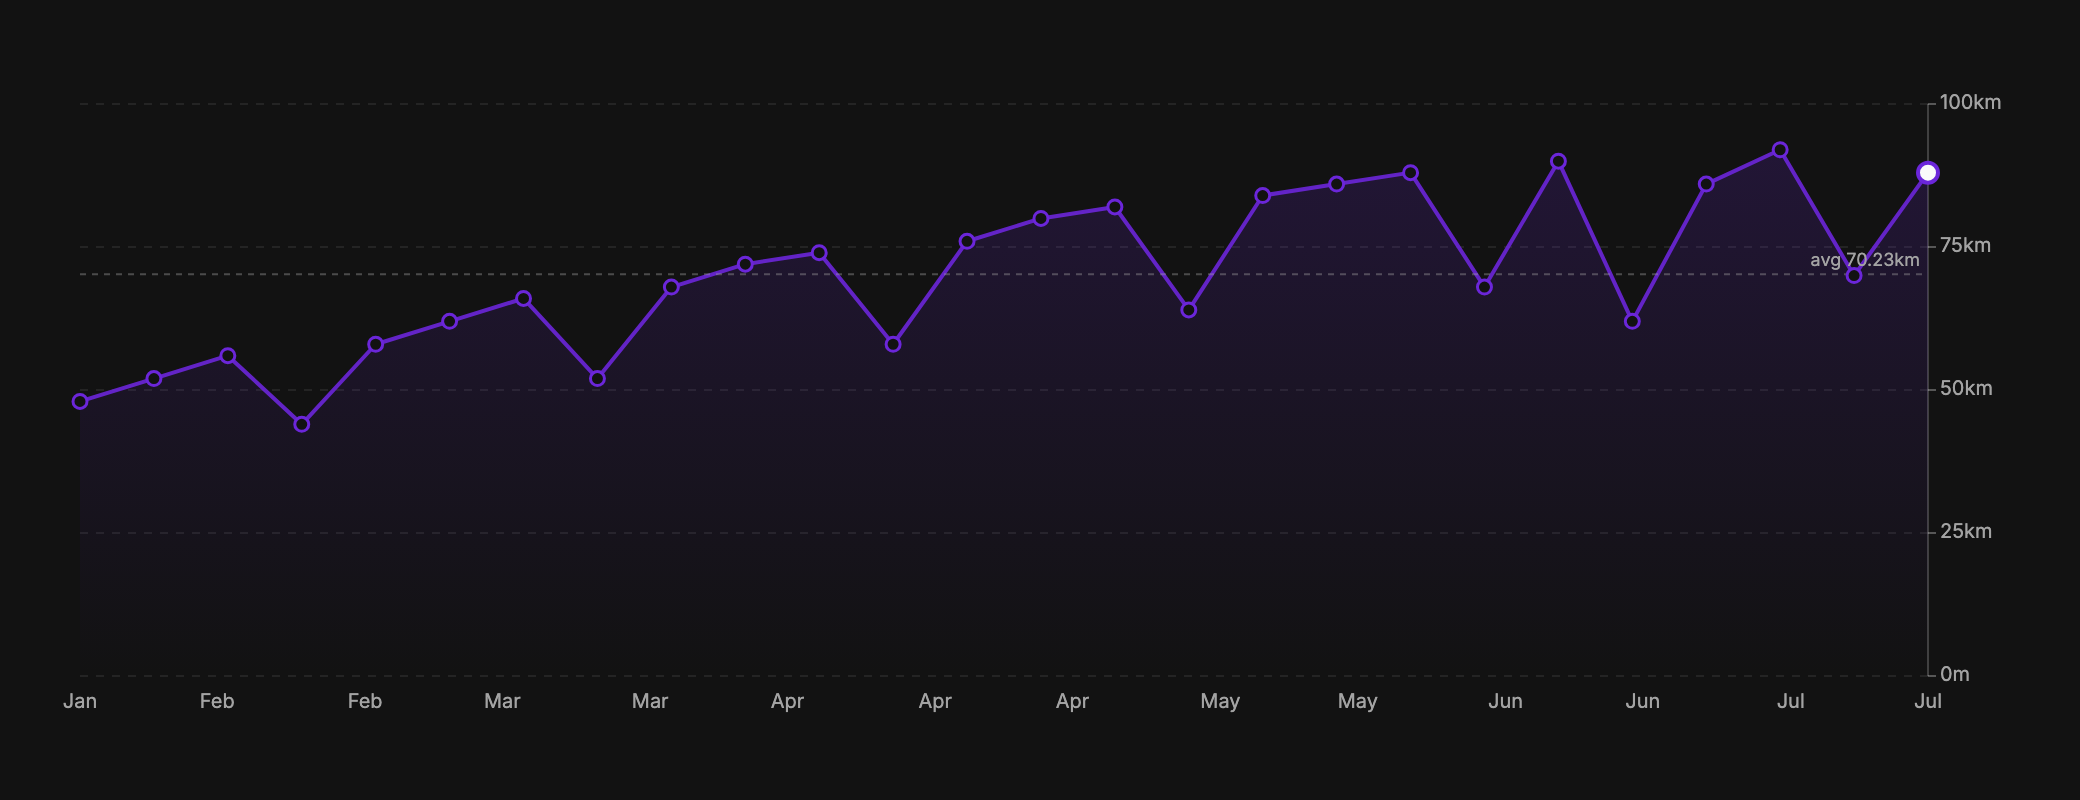
A volume chart is painted underneath and carries your own average as its reference, because the question a week's total answers is how it compares to a normal one.
Performance
One point per workout.
Pace
| Measure | What it tells you |
|---|---|
| Avg Pace | Whole-run average pace. |
| Avg GAP | Average pace normalised for the hills you ran. The honest way to compare a hilly run against a flat one. |
| Rep Pace | Pace across the work reps only, ignoring warmup, recovery and cooldown. |
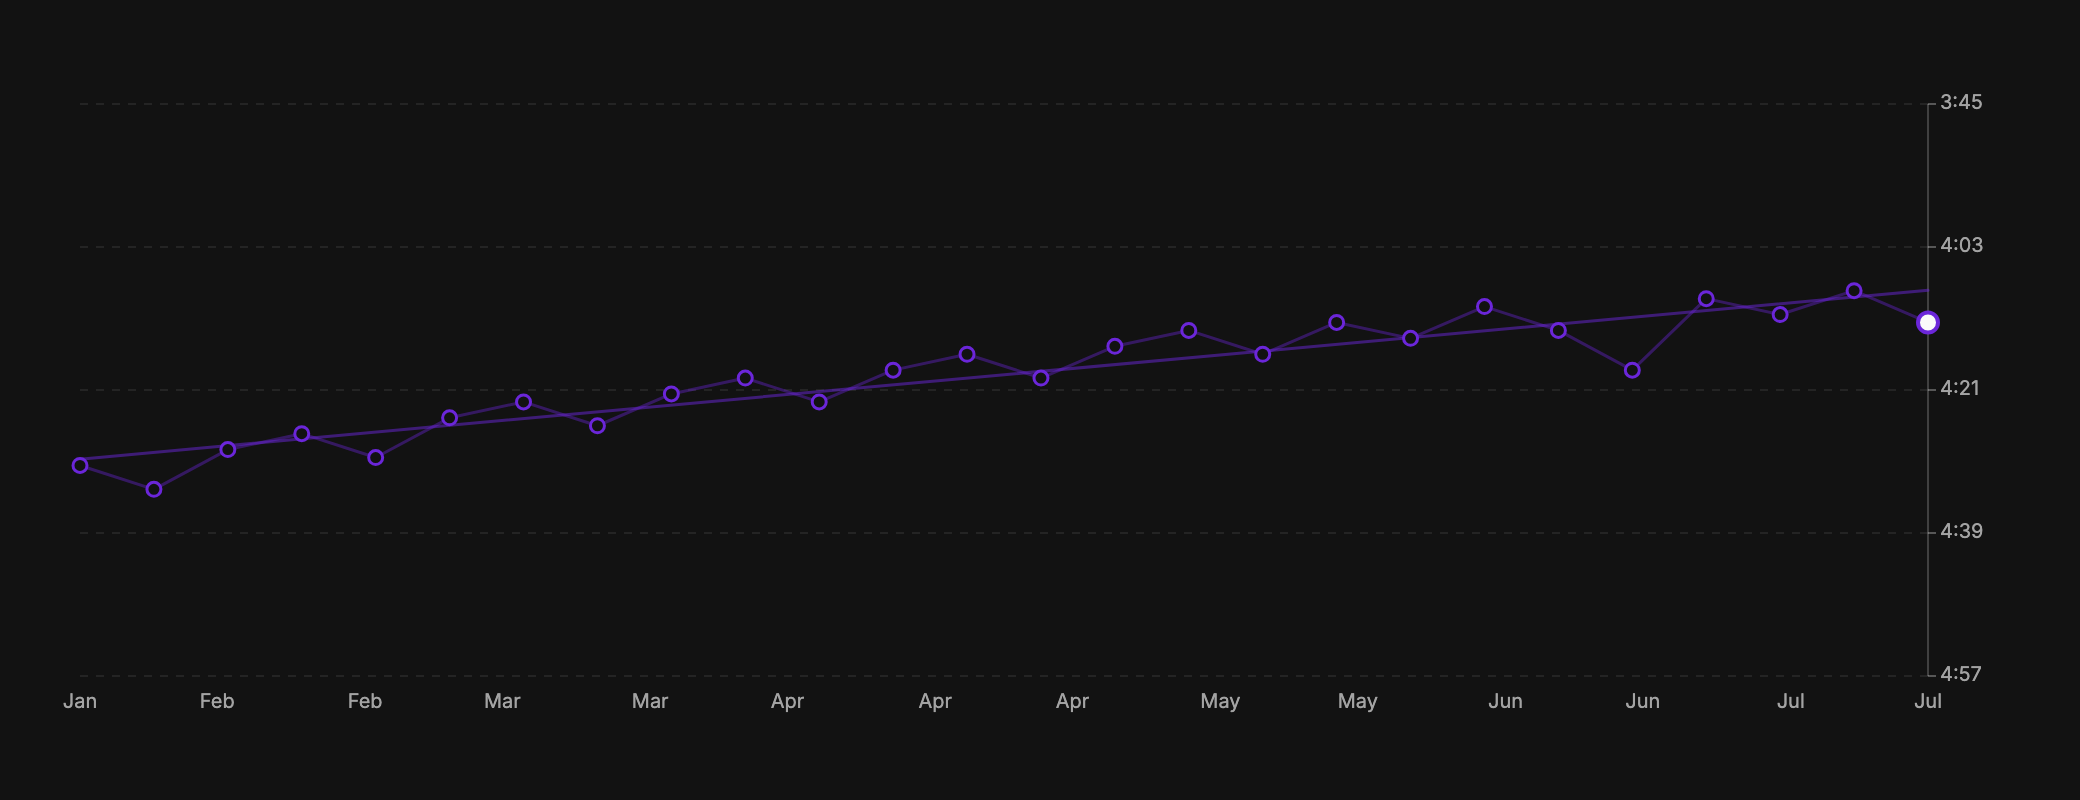
A pace axis runs the other way up, so faster is higher and improvement always climbs. The faint line is the trend across everything shown, because on a rate the direction is the question.
Rep Pace
Rep Pace is the average pace of the work reps in a quality workout. Runtool splits every completed activity into warmup, work, recovery and cooldown, then averages the work reps alone. A 5x1km session reports the pace of the five kilometres, not the pace of the 12 km run they sat inside.
Only the main set counts. A workout that opens with 8 km steady and finishes with 8x200m reports the 200s. A rep your watch split into two laps is joined back into one rep first, so a 1200m rep pressed as 800m plus 400m is priced as 1200m.
Rep Pace needs work reps Runtool could read from the activity file, so it covers your quality workouts and only those. Easy and long runs have no reps and no Rep Pace, whatever workout selection the picker is on.
Heart rate
| Measure | What it tells you |
|---|---|
| Avg HR | Whole-run average heart rate. Read next to pace: the same pace at a lower HR is fitness. |
| Rep HR | Heart rate across the work reps only. What the hard part of the workout actually cost. |
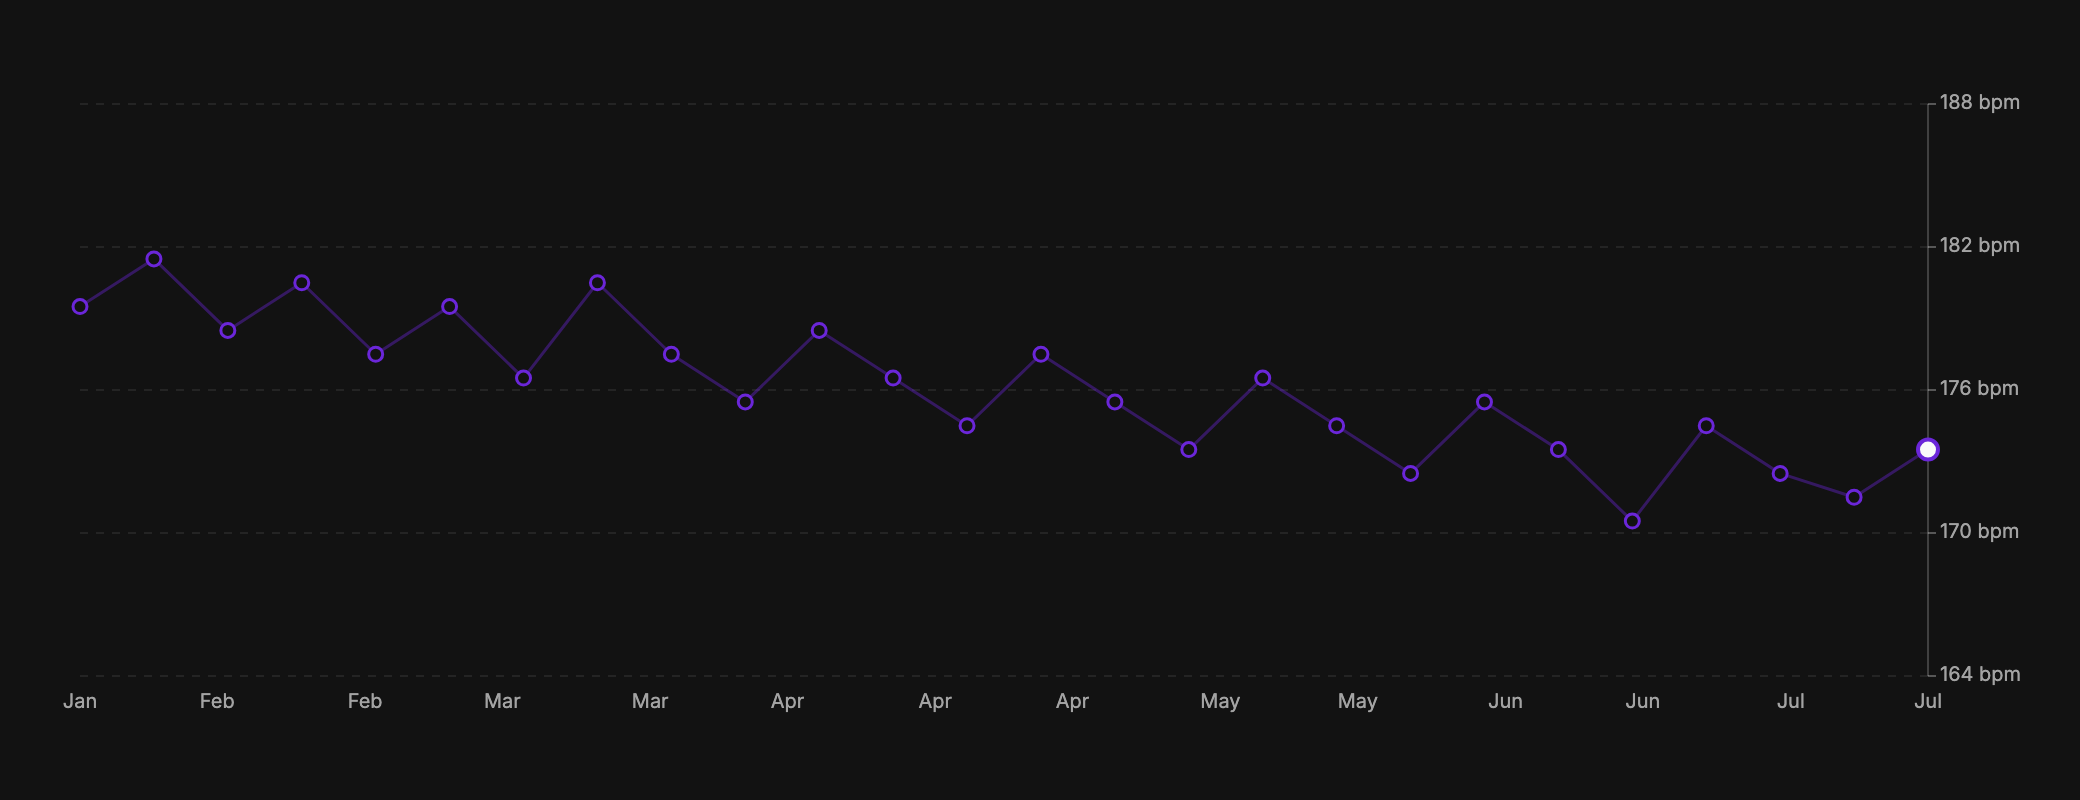
Read it next to the pace chart above: the same workouts run faster, at slightly less heart rate. Heart rate gets no trend line, because a few beats of drift is not a direction worth drawing.
Efficiency
Easy Efficiency vs Zones is where trends live. It measures how much less heart rate a run cost than your zones predict: the number that quietly improves when training works. Above the line is more efficient than predicted; below is less. See Pace methods and Zones.
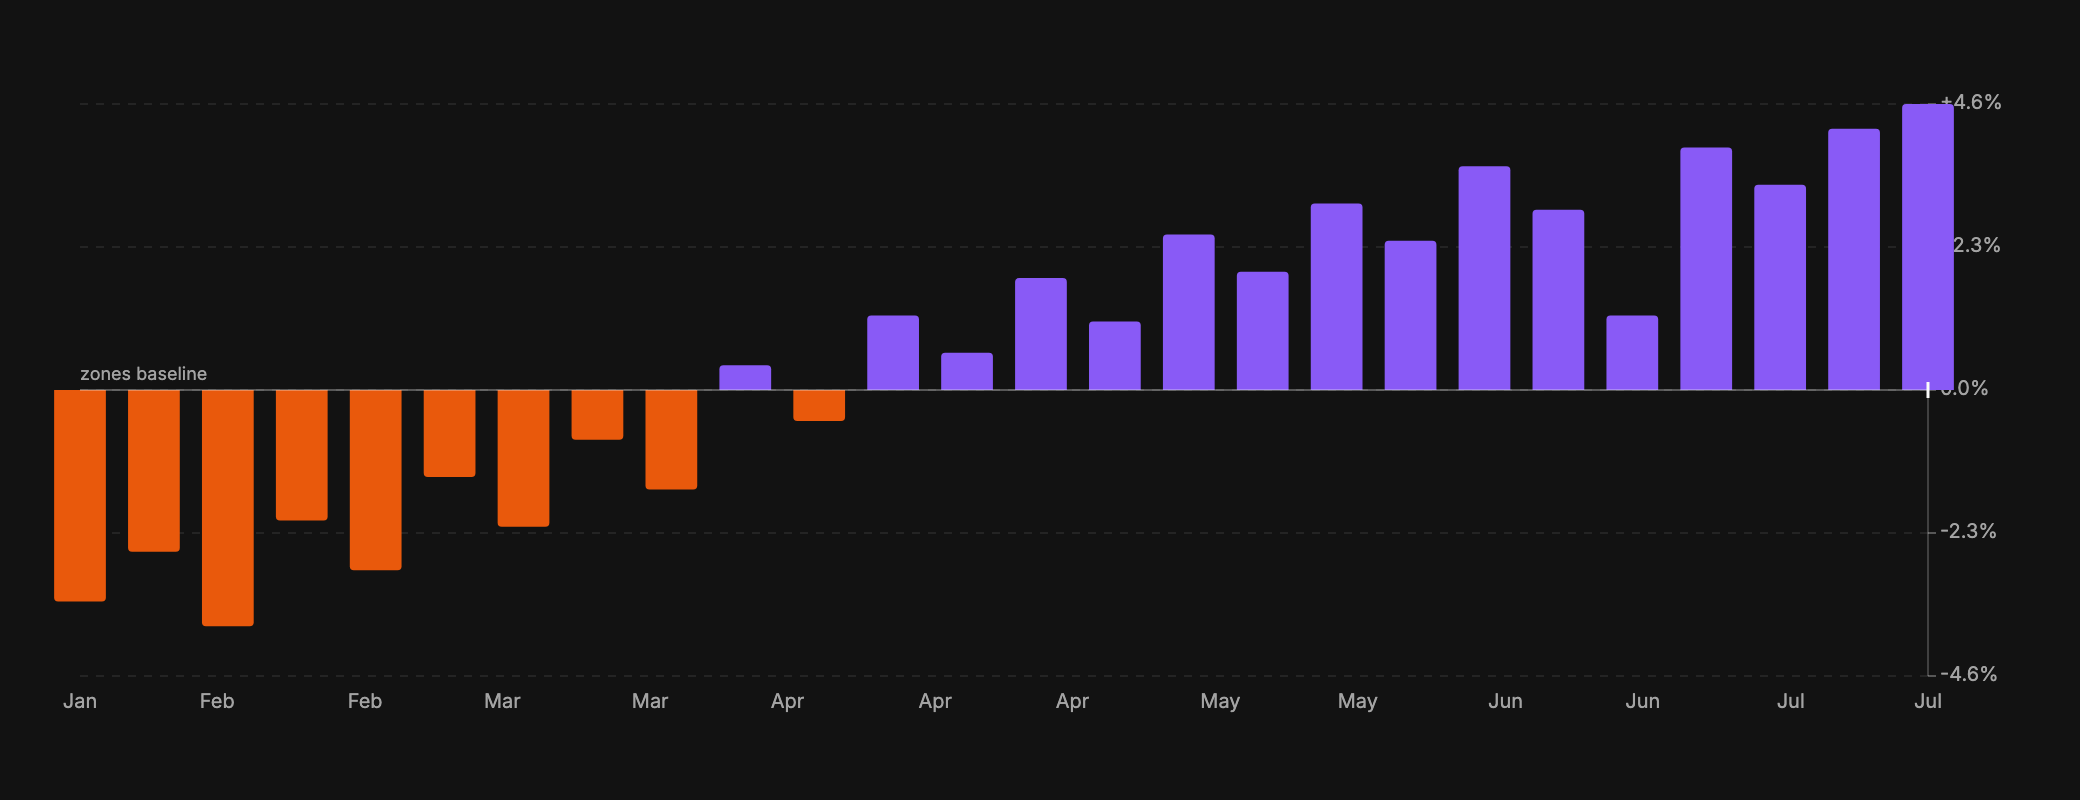
A signed deviation is the one measure drawn as columns rather than a line, because what it says is which side of the baseline a run fell on and by how much.
Subjective
From what you log after a workout, so they need no wearable.
| Measure | What it tells you |
|---|---|
| RPE | How hard the session felt, 1–10. Effort climbing while pace holds steady is an early fatigue signal. |
| Feeling | How you felt afterwards, 1–5. A run of low days next to rising load is worth acting on. |
How to read the charts
Every chart in Runtool follows the same rules, so a shape means the same thing wherever you see it.
| What you see | What it means |
|---|---|
| Solid line | Data that has happened. |
| Dashed line | A projection, planned or predicted, not yet run. Nothing else is ever dashed. |
| Dotted line | A reference: a baseline, an average, a threshold. |
| Shaded area | The points are totals over a period (a week's distance), not single measurements. |
| Hollow dot | A data point. |
| Filled dot | The point you are reading, the most recent, or the one under your cursor. |
| Faint straight line | The trend across everything shown. |
| Columns above/below | A measurement against a baseline. Above the line is better than the baseline, below is worse. |
On long ranges the individual dots disappear and only the line remains. At a year of training there are more points than there are pixels to draw them in. Hovering still reads out every one.
Efficiency charts draw a marker on the baseline each time you re-tested your zones. A step in the chart at that point is your baseline moving, not your fitness changing.
Range and display
- Date range: 3 months, 6 months, or a year.
- Display: per workout, per day, or per week. A chosen workout is always read per workout, so the option only appears across all runs.
The view state lives in the URL. Bookmark a chart or share it with your coach and they open exactly what you see.
The workout list
Below the chart, every workout in the current selection is listed with its completion data. The chart holds its place while the list scrolls, so an outlier and its explanation stay visible together. Select a workout to inspect it.