Views
Overview
The workspace Overview. Today's and tomorrow's workouts and the athlete's load and fitness at a glance.
The Overview is the front page of an athlete workspace, the dashboard you land on when you open it. It answers three questions in one screen: what needs me, what's next, and how is the load trending.
Identity row
The top of the page carries the athlete's identity on the first row and their standing values on the second: who this workspace belongs to, and the key numbers behind their current training. The health pill sits beside the name once a tracker is feeding health data.
The athlete's avatar and their About description read here; both are set in Athlete settings → Profile. The Overview is where you read the athlete's state, so nothing on this row is editable in place.
Today and tomorrow
The next two days of the plan sit front and centre. Each card shows the planned workout with its structure and targets; once completed, the card reflects what actually happened. From here you jump straight into the workout detail.
The same card holds a second view. Switch to Needs input for the past workouts with nothing recorded, and the completed ones with no effort rating. Each row is one click from the thing that is missing. A dot on the tag says something is waiting, so you can see it without leaving the day view. Rows disappear as they're filled in. The same dot marks the workouts themselves. See Needs input.
On a row for a workout that never happened, Mark as skipped says it didn't happen, and the row goes. See Log a workout.
Health
The health card trends one signal at a time over the last 28 days, against the athlete's own 28-day baseline (the dashed line). Pick the signal with the tags under the heading:
- HRV, Sleep, Resting HR, and Readiness come from a connected wearable that shares health data. See Integrations.
- RPE and Feeling come from the athlete's workout journaling, so they need no wearable.
A signal only gets a tag when it has readings in the window. An athlete with no health-capable integration sees RPE and Feeling; a wearable that doesn't report readiness leaves that tag out. With nothing recorded at all, the card offers RPE, Feeling, and a link to connect a tracker.
A day with two workouts keeps both values: two dots in that day's column, with the line through their average. The number in the top right shows the hovered day while you hover the chart, and otherwise the most recent value with a 7-day average.
Load & fitness
The load widget charts the athlete's training load over time, with a projection over the coming days of the plan:
- The load lens shows acute load (recent days) against chronic load (the longer baseline), and the ACWR between them.
- The fitness lens shows fitness, fatigue, and form derived from the same load history.
The widget reads from completed training plus the upcoming plan, so you see where the current week is taking the athlete before it happens. For the model behind these numbers. See Training load.
Weekly volume
Underneath, running volume is totalled per week over the last twelve, with the coming planned weeks carried on the same axis.
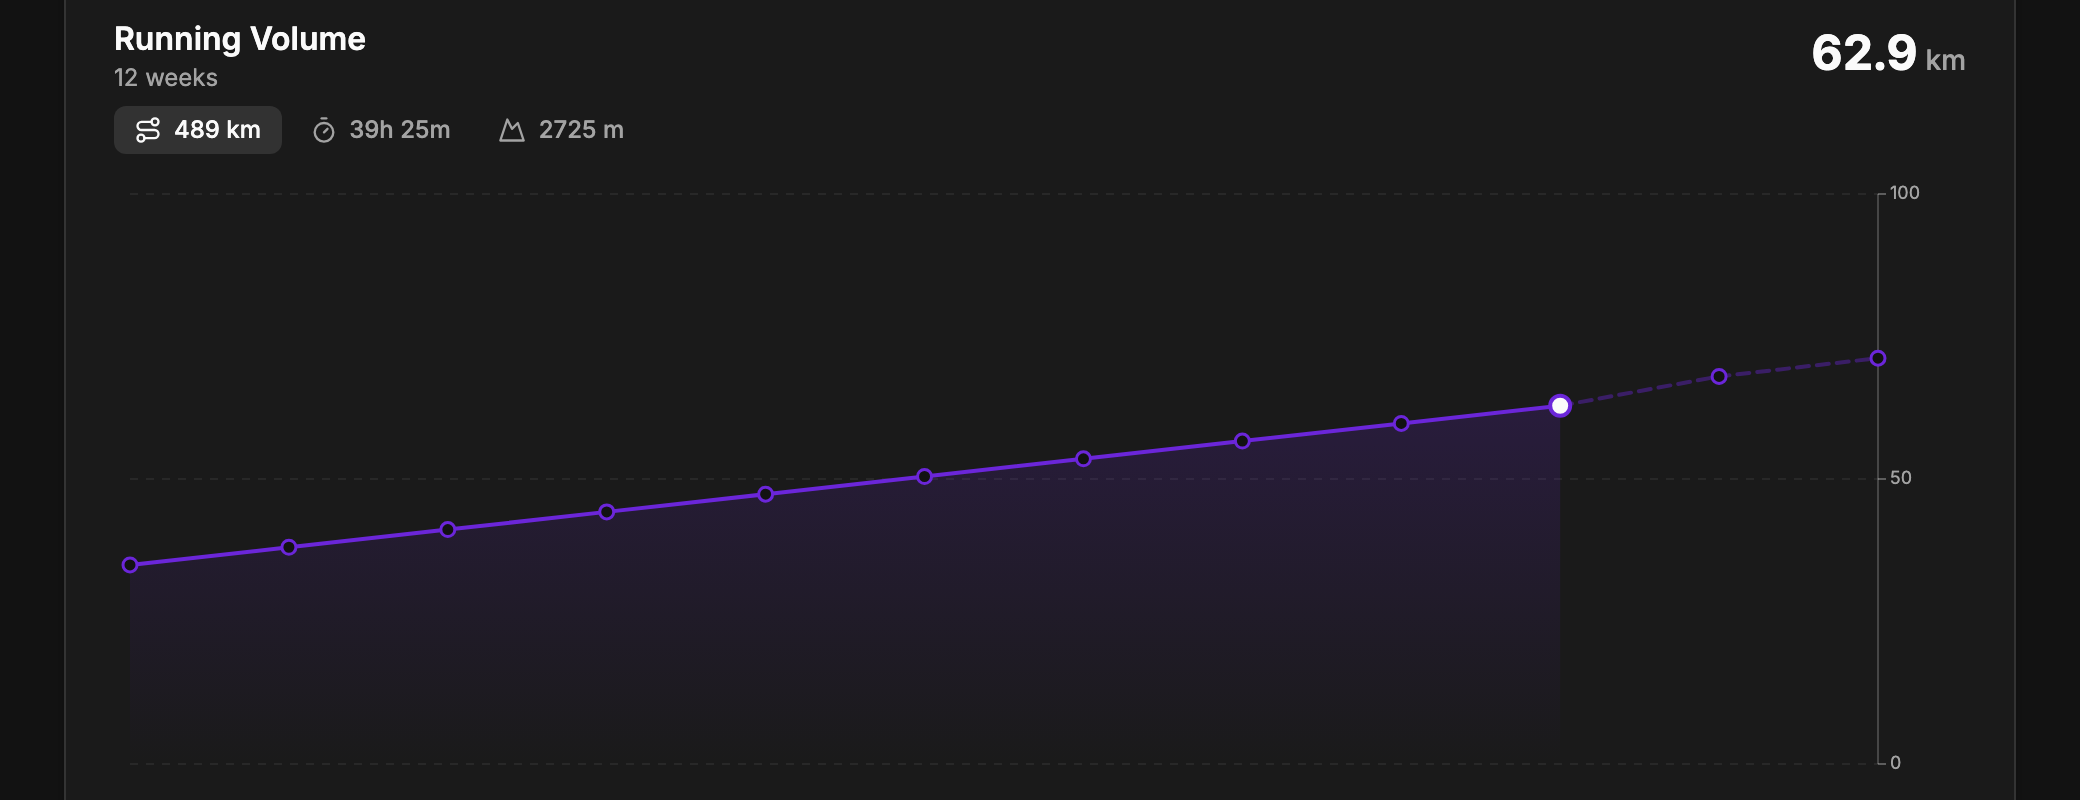
Completed and planned are drawn apart on purpose: the gap between them is the week you are in, and how much of it is still to run. Switch the total between distance, time and elevation. A single run says little about whether training is building, which is why nothing here is shown per day.
Where to go from here
- Plan the week in the Calendar.
- Dig into completed training in Analyse.
- Change zones and the athlete's details in Athlete settings.